Infographics: data and analysis of Australian banking and related activities.
Infographics are downloadable and shareable.
The ABA has produced a wide spectrum of Australian banking and banking-related infographics, from the the impact of COVID-19 on lending, the rise and fall of loan deferrals, to scams data, transactions, changes in payment types, agribusiness lending to the drop in Net Interest Margins (NIM)s over the past two decades.
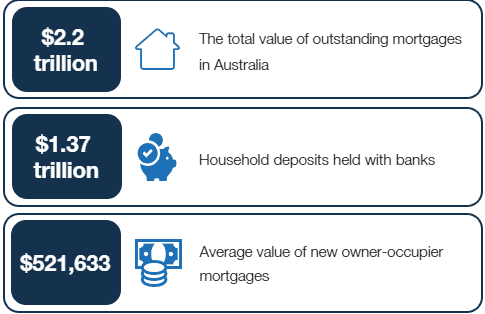
Households: 2023
Australian households hold $2.2 trillion in mortgages and $1.37 trillion in deposits
Lending to agribusiness
Bank lending to agribusiness has risen to a record $104.7b as at September 2022.
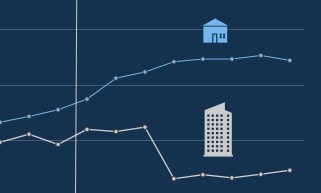
Construction lending in Australia
•In July 2022, banks had around $22b in outstanding loans to the construction industry.
•This breaks down to roughly $13b for resident
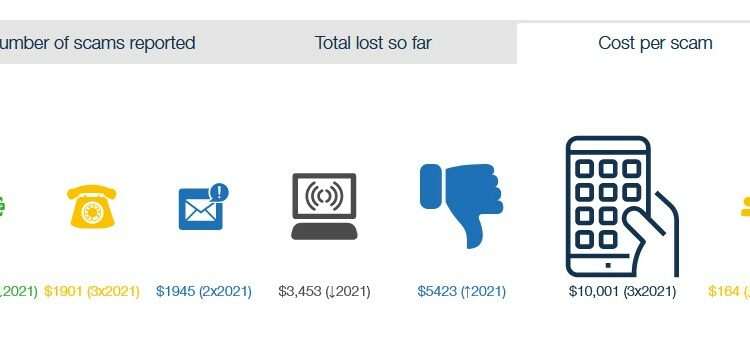
Scams: A snapshot
Mobile Apps averaged $18k per scam. 12% of reported scams resulted in financial losses for a total of $336 million lost.
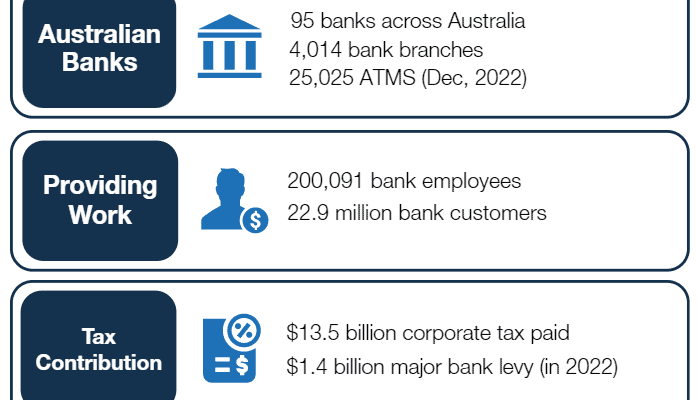
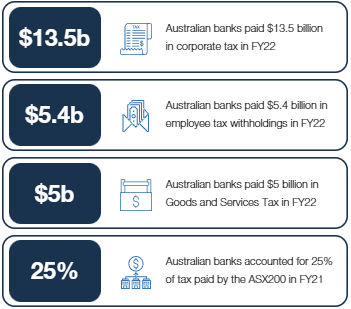
Banking by numbers: 2023
There are 95 banks in Australia and
200,091 bank employees serving 22.9 million customers.
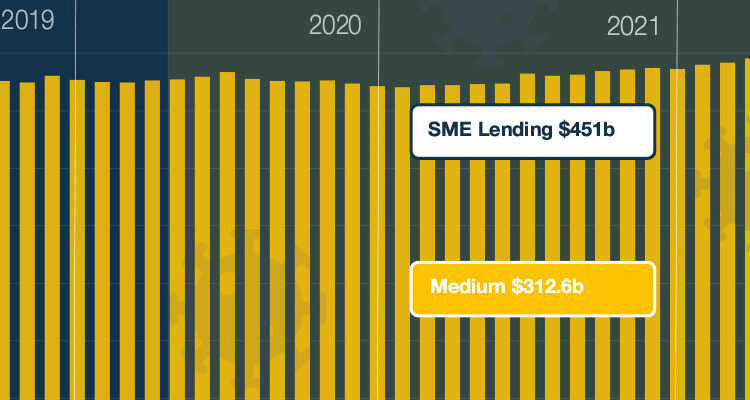
Lending to Australian SMEs
In April 2022 alone, over $13 billion in new loans were provided to micro, small and medium businesses.
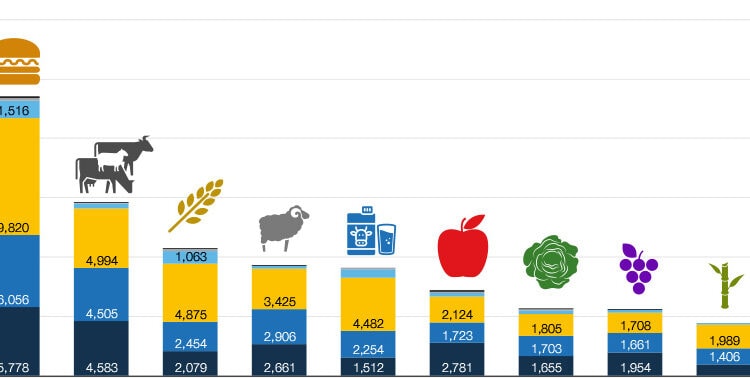
Top 20 agri, by turnover
Australian agriculture sectors, ranked by turnover, June 2021.
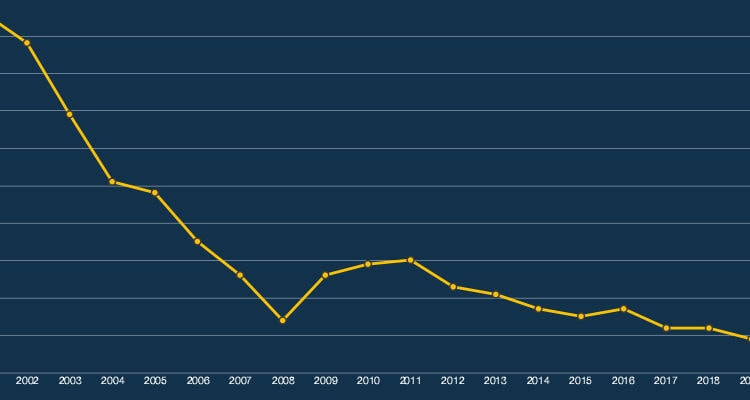
Net Interest Margins
Over the past two decades, Australian bank industry Net Industry Margins (NIMs) have been in decline.
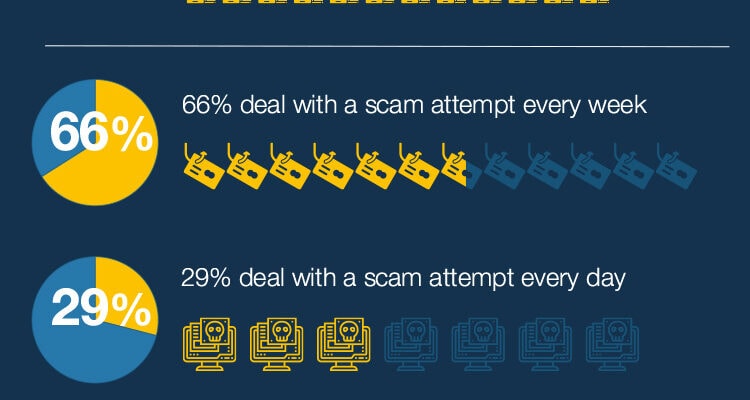
Scams: the growing problem
37% of Australians know a close friend or family member who’ve lost money to a scam.

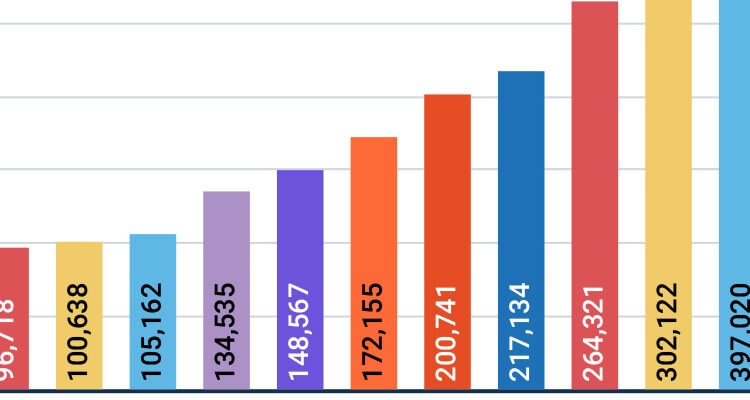
Bar race: agri exports
The nature of Australian export volumes have changed dramatically from 1989. Greasy wool, wine, forestry, wheat and beef have all exchanged the top spot.
SMEs by industry
There were 2.35 million SMEs in Australia in 2020. The most (almost 400k) SMEs were in the construction industry.